Status of CCAP actions

As of Winter 2024 out of 89 actions:
- 54 actions have been completed, including 41 continuous improvement actions
- 31 actions are underway
- 4 actions have not been started
The City relies on data and emission factors with varying data processing timelines. Data and emission factors may not be released for up to two years after a given calendar year. The inventory is developed based on best available data at the time of publication and may be updated in future publications.
Currently, the City is using this inventory to inform the development of science-based targets aimed at reducing emissions and achieving net-zero goals for both corporate operations and the broader community. All greenhouse gas (GHG) numbers are currently unaudited by a third party.
Greenhouse gas emissions in the corporation
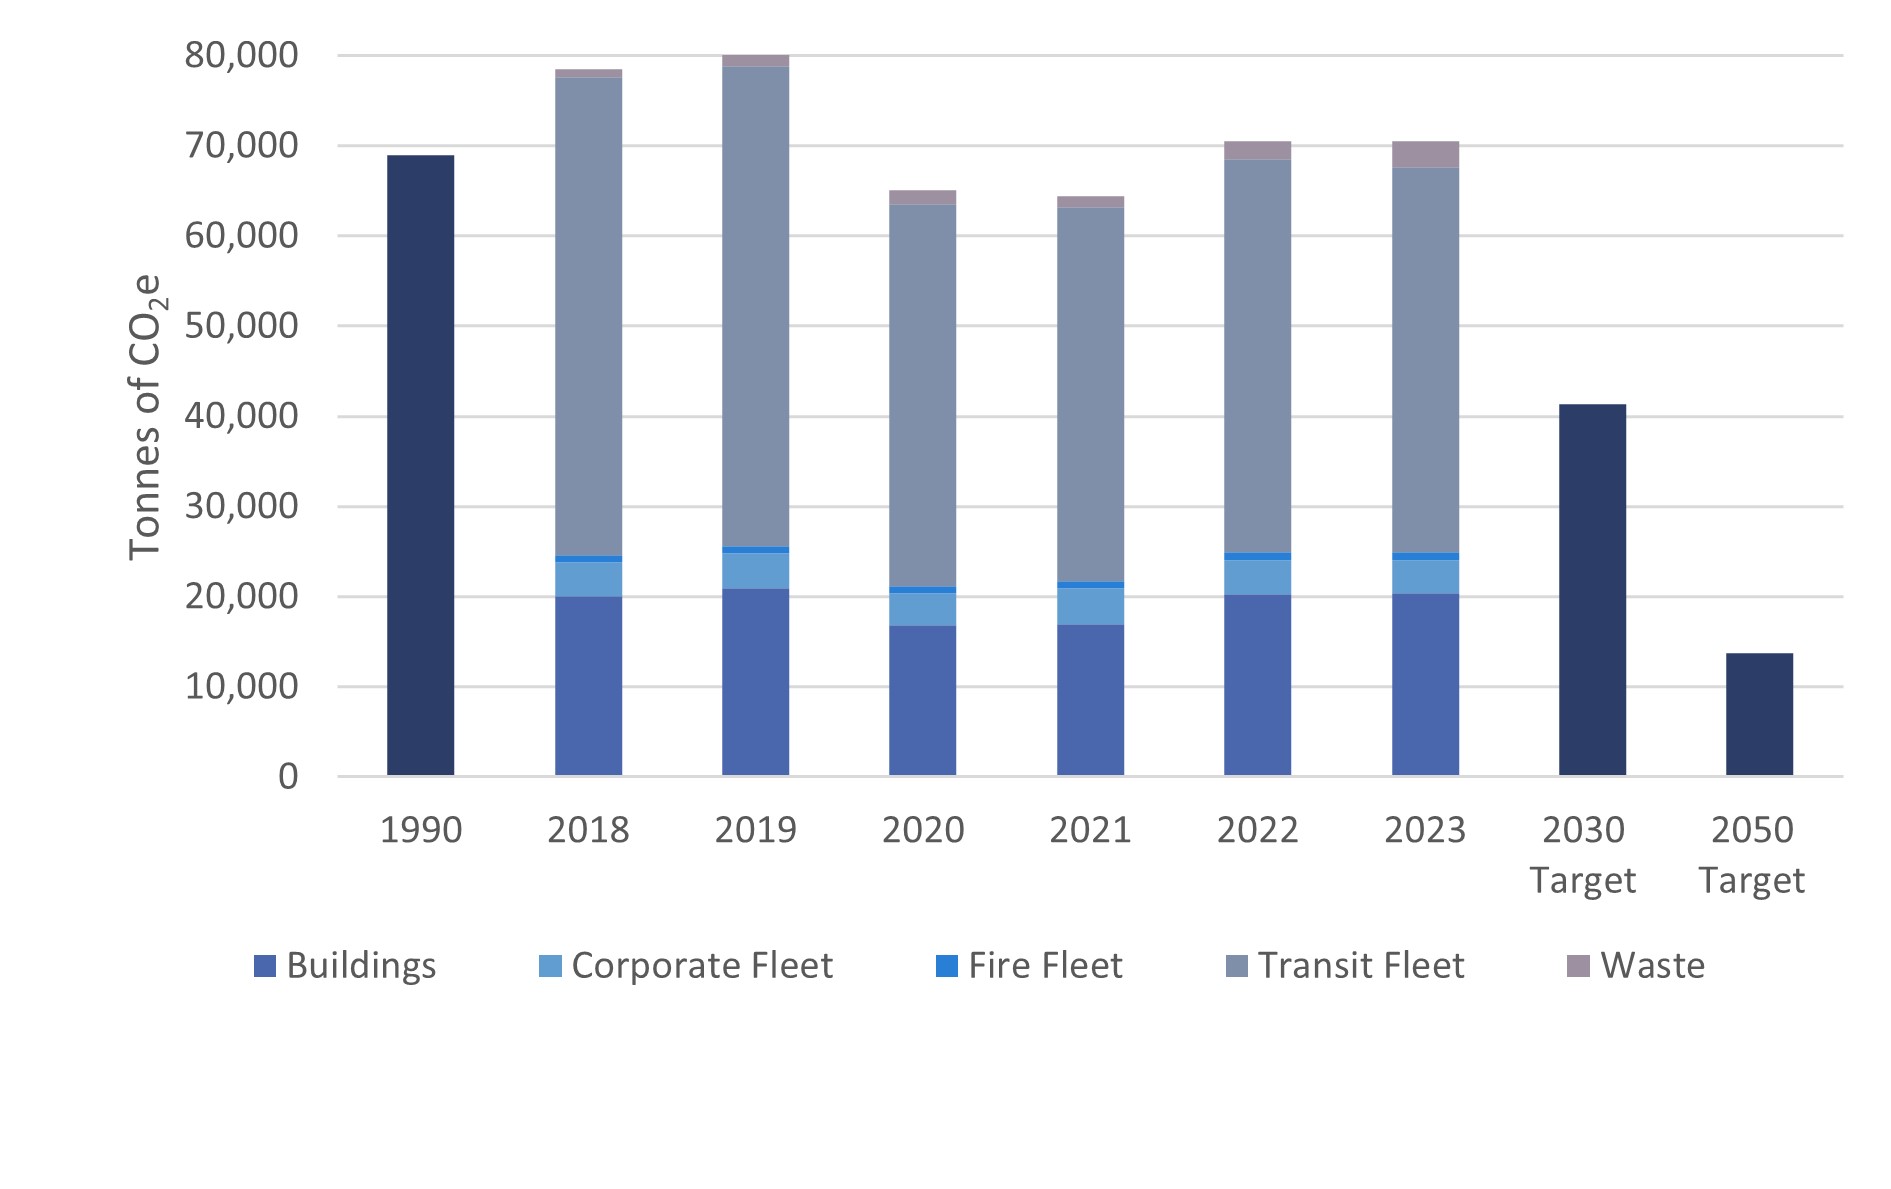
There are five main sources of GHG emissions from municipal operations and services. The main sources and the percentage of GHG emissions they account for include:
- MiWay transit (61%)
- Municipal buildings (29%)
- Fleet (6%)
- Waste (4%)
In 2023, total GHG emissions for the corporation was 70,556 tonnes of carbon dioxide equivalent. This equals a 2% increase for corporate emissions above 1990 levels but a 12% decrease since the CCAP was approved in 2019.

Greenhouse gas emissions in the community
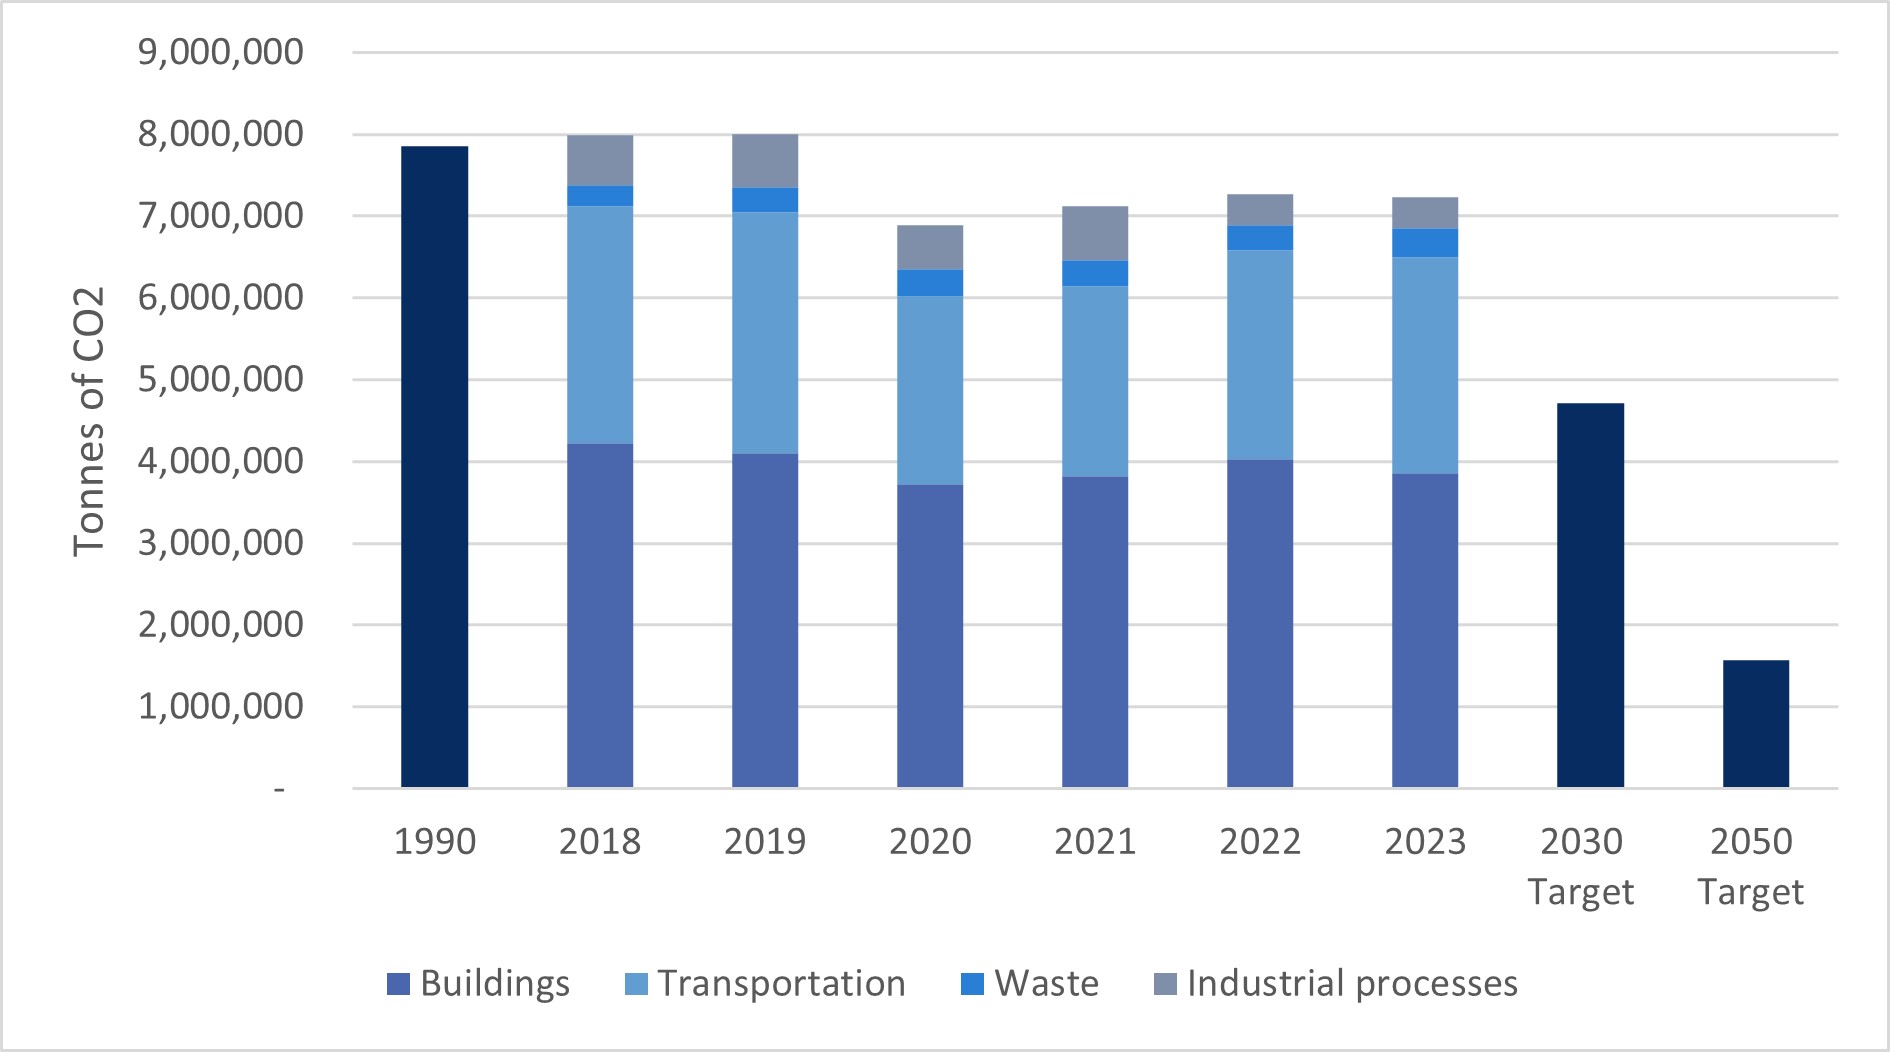
Within the entire City, there are four main sources of GHG emissions. The main sources and the percentage of GHG emissions they account for include:
- Buildings (53%)
- Transportation (37%)
- Industrial processes (5%)
- Waste (5%)
In 2023, total GHG emission for the community was 7,233,297 tonnes of carbon dioxide equivalent. This equals an 8% reduction below 1990 levels and a 10% decrease below 2019 levels, which was the year CCAP was approved.
